To monitor Nginx Ingress metrics with prometheus and grafana, you need to install customize prometheus and grafana
At first setup nginx ingress using helm
kubectl create ns ingress-nginx
helm repo add ingress-nginx https://kubernetes.github.io/ingress-nginx
helm repo update
helm install ingress-nginx ingress-nginx/ingress-nginx
Then upgrade the nginx ingress to allow and create metrics scrapping service
helm upgrade ingress-nginx ingress-nginx/ingress-nginx \
--namespace ingress-nginx \
--set controller.metrics.enabled=true \
--set-string controller.podAnnotations."prometheus\.io/scrape"="true" \
--set-string controller.podAnnotations."prometheus\.io/port"="10254"
Then need to insatll prometheus. It can be installed by collecting all of the yaml files from this link: https://github.com/kubernetes/ingress-nginx/tree/main/deploy/prometheus
Or, just simply run this command if you want to deploy prometheus in ingress-nginx namespace
kubectl apply --kustomize github.com/kubernetes/ingress-nginx/deploy/prometheus/
Then Insatll grafana
kubectl apply --kustomize github.com/kubernetes/ingress-nginx/deploy/grafana/
NodePort
Note the NodePort of the services
kubectl get svc -n ingress-nginx
You can simply access the grafana and prometheus dashboard by master ip of your kubernetes cluster and nodeport of prometheus-server and grafana.
http://master-ip:nodeport
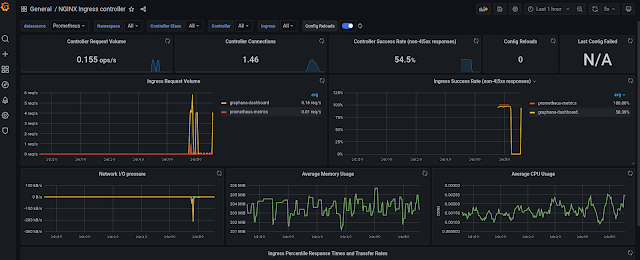
To import dashboard click on the + sign on left sidebar and click import. Give 9614 as id and click load. Then select the datasource and import. Dashboard Link: https://grafana.com/grafana/dashboards/9614
ClusterIP
If you want to access using ClusterIP and nginx ingress then simply edit the services of prometheus & grafana and change from NodePort to ClusterIP
Then apply the ingress with your domain for grafana and prometheus
apiVersion: networking.k8s.io/v1
kind: Ingress
metadata:
annotations:
kubernetes.io/ingress.class: nginx
name: graphana-dashboard
namespace: ingress-nginx
spec:
rules:
- host: grafana.devops.com
http:
paths:
- backend:
service:
name: grafana
port:
number: 3000
path: /
pathType: ImplementationSpecific
apiVersion: networking.k8s.io/v1
kind: Ingress
metadata:
annotations:
kubernetes.io/ingress.class: nginx
name: prometheus-metrics
namespace: ingress-nginx
spec:
rules:
- host: prometheus.devops.com
http:
paths:
- backend:
service:
name: prometheus-server
port:
number: 9090
path: /
pathType: ImplementationSpecific
Download Coding Interview Book and Get More Tutorials for Coding and Interview Solution: Click Here
Download System Design Interview Book and Get More Tutorials and Interview Solution: Click Here
Do you need more Guidance or Help? Then Book 1:1 Quick Call with Me: Click Here
I am Ashadullah Shawon. I am a Software Engineer. I studied Computer Science and Engineering (CSE) at RUET. I Like To Share Knowledge. Learn More:
Click Here

0 comments:
Post a Comment